See the share of the college cost a 529 is on track to cover, and the extra monthly amount that reaches your target.
Open the demo →Beneficiary
yrs
yrs
$
$
/mo
%
Scenario
Assumptions
%/yr
%/yr
College cost covered38%$79,730 of $210,093 over 4 years
Extra monthly to hit target+$505/mocloses the $130,363 shortfall, on top of $250/mo until 2039
Chance of hitting target0%of 600 simulated futures
Balance vs cost
$0$100K$200K
202620352043
Projected balanceSimulated range (middle 80%)Cost of college · $210,093Enrolls 2039 · runs dry 2040
Light band: where the balance lands in 8 of 10 simulated futures, with yearly returns that swing like a stock-heavy portfolio's.
College Board sticker costs
School costs start from College Board 2025-26 sticker averages: tuition, fees, housing and food.
No aid, scholarships or loans
Financial aid, scholarships and student loans aren't in this plan.
One flat return
Returns are one flat 6% a year, in every year. Nothing shifts toward bonds as enrollment nears.
Contributions stop at enrollment
Monthly contributions, regular and extra, stop at enrollment. A one-time payment can still land in a college year.
529 rollover rules not checked
529 money can move to another family member, or under §529(c)(3)(E) to the beneficiary's own Roth IRA, subject to conditions this plan doesn't check. They include a 529 open at least 15 years, a $35,000 lifetime cap, and only contributions at least five years old.
These figures are estimates for planning, not investment, tax, or legal advice. Read the full disclaimer
In Taiga Finance
The same planner, on the 529s you actually hold.
Connect or add the 529 and the planner runs on its real balance, per child, stays current as the balance moves, and keeps the scenarios you save.
Join the waitlist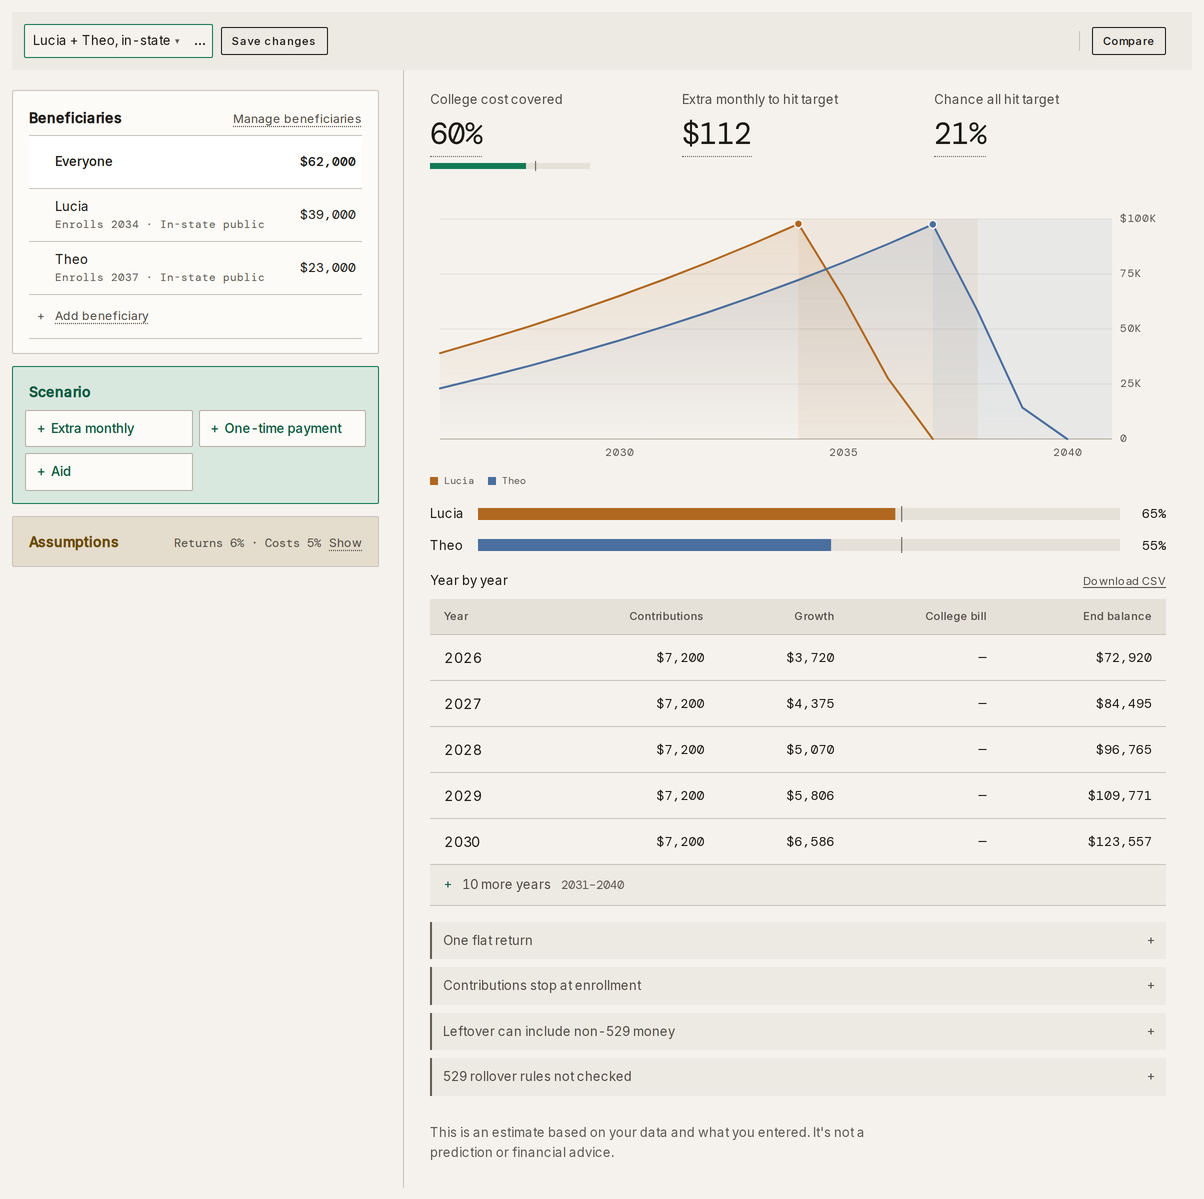
How this calculator works.
Two curves race each other: the college bill, which inflates every year until enrollment, and the 529 balance, which grows on your contributions and returns until the bills start. The calculator inflates a year's cost forward to the year your child enrolls, totals four years of bills, then projects the balance that a starting amount and monthly contributions reach by that date. The savings side is the standard future-value formula for a lump sum plus a stream of deposits:
Cost = C₀ × (1 + g)n · Saved = B × (1 + r)n + M × 12 × [((1 + r)n − 1) ÷ r]
C₀ = one year's cost today · g = college-cost inflation · n = years until enrollment · B = 529 balance now · M = monthly contribution · r = expected return
Where the bill outruns the balance
A year’s cost inflated at 5% across eighteen years more than doubles before the first bill arrives. That default is what pulls the bill line up year after year while the balance line is still catching up.
The school presets
The three school costs are the College Board’s 2025-26 averages for tuition, fees, housing and food: $25,850 a year in-state public, $45,780 out-of-state public, $60,920 private nonprofit. Picking a school fills the cost in; typing a cost of your own keeps it until you restore the default.
Extra contributions and one-time payments
An extra monthly amount can run from a year of your choice until enrollment, or over a window with an end year. A one-time payment lands at the end of the year you pick, and can land in a college year. Both show up as a change against the plan without them: coverage points gained, the monthly figure that comes down.
How the projection draws down
For each college year, the calculator inflates that year’s bill, withdraws it from the balance at the start of the year, and lets whatever is left keep growing. Drawing at the start rather than the end is the conservative choice — it doesn’t hand a funded plan an extra year of growth on money that’s already spent. Contributions stop at enrollment, so a family that keeps paying in through college does better than the projection shows.
What it leaves out
Financial aid, scholarships, grants and loans — nothing is subtracted for them, so the projection is sticker cost against savings. It assumes one flat return every year rather than an allocation that shifts toward bonds near enrollment, and it holds contributions flat until the first bill. The shaded range on the chart comes from 600 simulated futures with returns that swing year to year; it is a model of the funding math, not a financial-aid estimate.
Terms used here.
- 529 plan
- A tax-advantaged account for education costs. The balance grows untaxed, and withdrawals are untaxed when they're spent on qualified education.
- Beneficiary
- The child a 529 is saved for. The calculator projects one child at a time.
- Sticker cost
- A year's published price: tuition, fees, housing and food. The defaults are the College Board's 2025-26 four-year averages for in-state public, out-of-state public and private nonprofit schools.
- College-cost inflation
- The yearly rise in the cost of a year of college. The default here is 5%.
- Coverage
- The share of the projected bill the savings are on track to pay. A savings target below 100% assumes aid, loans or the student covers the rest.
- Simulated range
- The shaded band on the chart: the 10th to 90th percentile of 600 simulated futures, each with its own run of yearly returns (a 13-point swing around the flat return), so 8 in 10 land inside it. 'Futures that cover the cost' counts how many of the 600 covered the cost, or the target share of it.
Asked often.
More than it costs now, because the bill inflates every year until they start. The calculator inflates the cost you enter forward to the enrollment year and totals the four bills.
It depends on the balance you start with, the return you assume, and how many years are left before enrollment. The calculator solves for the extra monthly contribution that closes the gap to your savings target, and the figure updates as you change the inputs.
The default is 6% a year, nominal — inflation is left in the number rather than taken out, since the college bill is inflating too. A more conservative case, or a plan that shifts toward bonds as enrollment nears, would assume less.
No. It projects sticker cost against your savings, with nothing subtracted for aid, grants, scholarships or loans. To model your share of the bill rather than the whole thing, lower the savings target below 100%.
No. The calculator runs in your browser and nothing you type is sent anywhere. Inside Taiga Finance, the same planner runs on a 529 you connect or add, per child, and stays up to date as the balance changes.