Savings rate
A savings rate is the share of income set aside rather than spent: what goes to investments and savings, divided by income. Over take-home pay it is one figure; the same household's contributions over gross pay are a smaller one, because taxes and payroll deductions sit in the denominator.
What is a savings rate?
The numerator is what goes to investments and savings: retirement contributions, a brokerage, a savings fund. The denominator is income, and there are two common choices. Take-home pay is the amount deposited after taxes and payroll deductions. Gross pay is the amount before them.
The same dollars set aside make a higher rate over take-home than over gross, because take-home is the smaller number. A contribution deducted before the paycheck lands, such as a 401(k), comes out of gross pay before take-home is worked out. On the gross basis it counts as money set aside; on the take-home basis it is either left out or added on top of what the deposit sets aside.
A savings rate can be planned or realized. The planned rate is what a budget sets aside before the month. The realized rate is what was left after the month's spending: income minus spending, divided by income.
How a savings rate works, with numbers
A household's take-home is $6,000 a month, and its plan puts $600 toward investments and $300 toward savings. That is $900 set aside, 15% of take-home: 10% for investments and 5% for savings.
Its gross pay is $7,500, with $1,500 going to taxes and payroll deductions before the deposit. The same $900 is 12% of gross.
- Investments
- $600
- Savings
- + $300
- Total set aside
- $900
- Take-home
- ÷ $6,000
- Rate, over take-home
- 15%
- Gross
- ÷ $7,500
- Rate, over gross
- 12%
Why a savings rate matters
A rate is comparable with another only on the same basis. 15% over take-home and 12% over gross describe the same $900; side by side without the basis, they read as two households.
A rate travels with income where a dollar amount doesn't. At $7,000 of take-home, the same $900 is 12.9%, and 15% is $1,050.
Savings rate in Taiga Finance
On the Plan, Taiga Finance shows no savings rate. The band at the top draws the planned Investments and Savings amounts as segments of the month's take-home, in dollars, beside Spending. Take-home there is the sum of the paycheck lines' monthly amounts; the band's working lists “Total income” and “Before take-home”, the pre-tax deductions, above it.
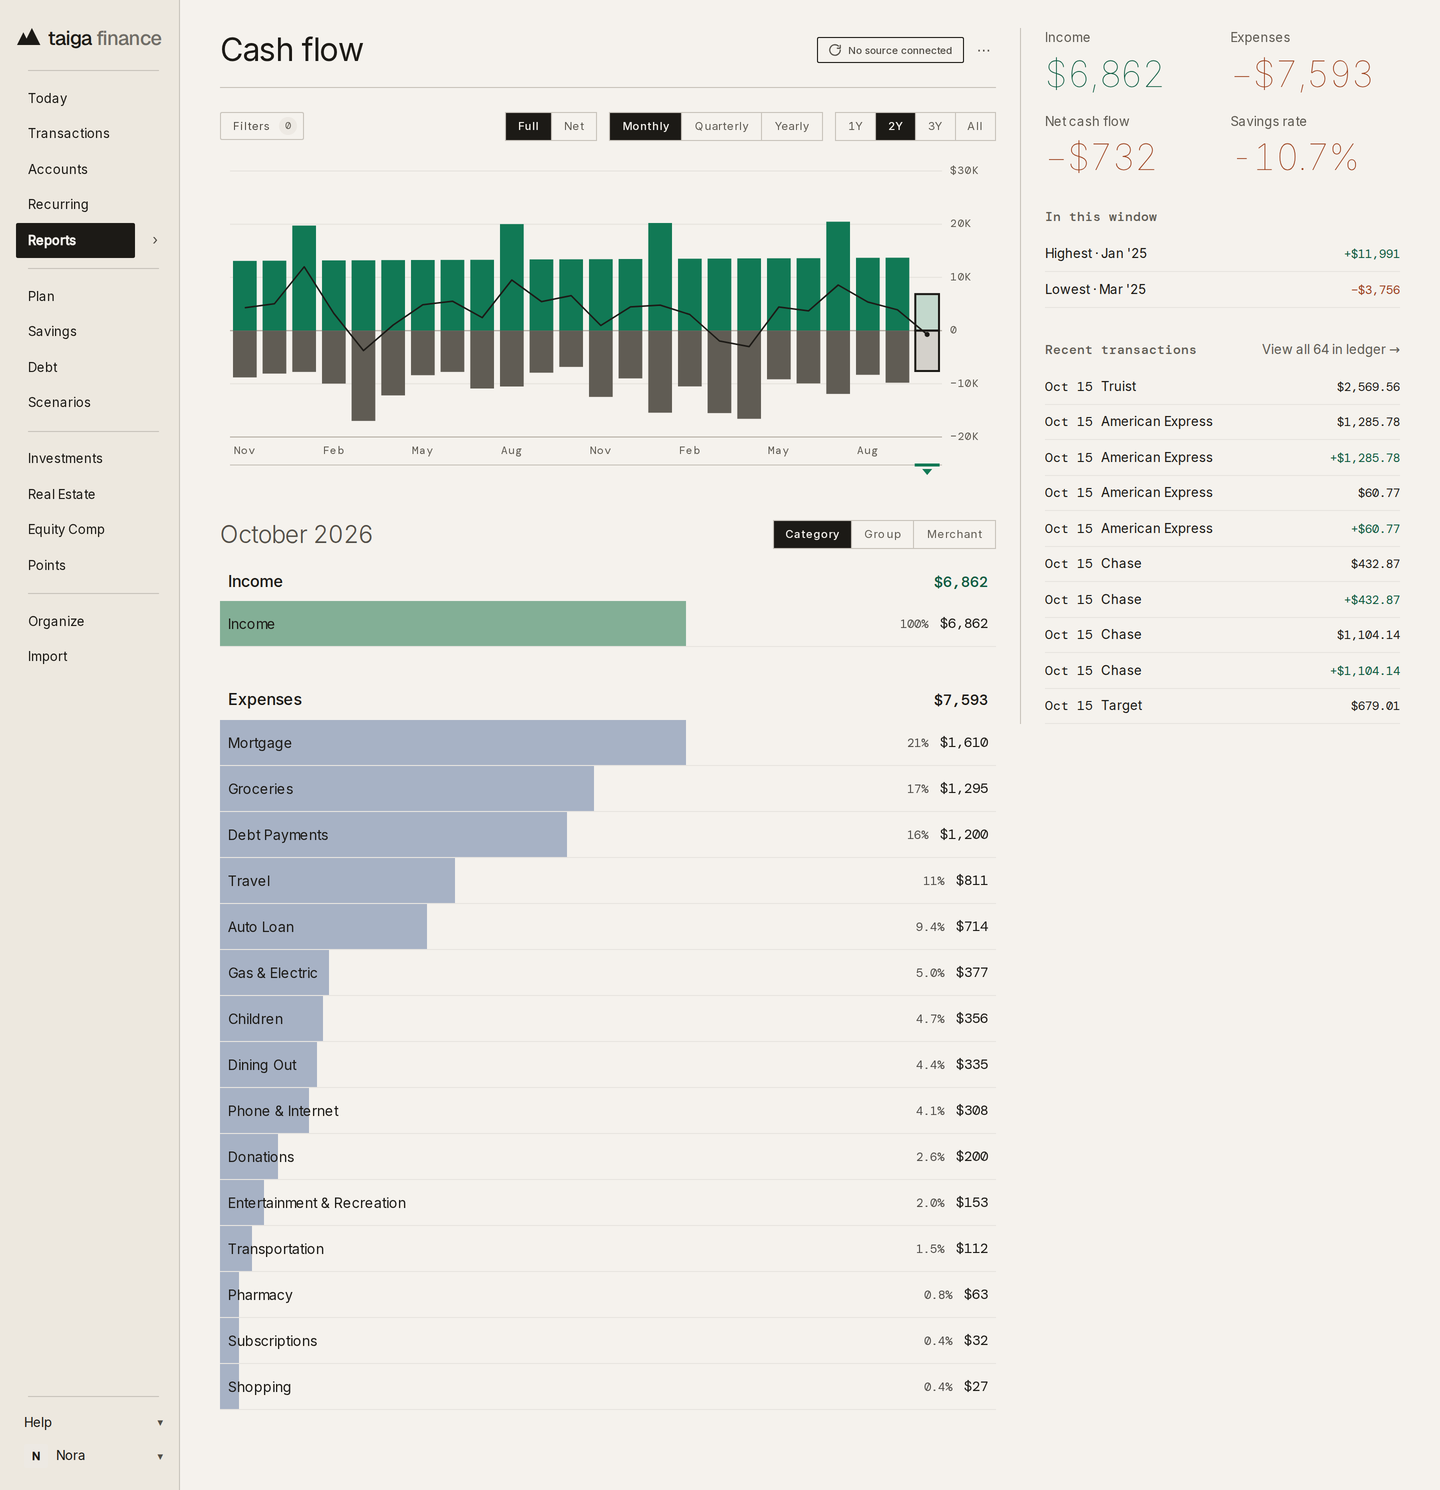
The figure Taiga Finance labels “Savings rate” is a realized one, on the Cash flow report: net cash flow, income minus expenses for the period, divided by income, with the figure's popover reading “Net”, “÷ Income” and “= Rate”. Income there is the deposits in the Income category, a take-home basis, and the rate reads “—” in a period with no income. The same rate closes the Plan vs. actuals table, as an average over the completed months in the window.
No rate is shown on a gross basis.
Plan & goals →Key takeaways: Savings rate
- A savings rate is what goes to investments and savings, divided by income.
- The same dollars set aside are a higher rate over take-home than over gross, because take-home is the smaller number: $900 is 15% of $6,000 and 12% of $7,500.
- A planned rate is set before the month; a realized rate is income minus spending, over income, after it.
- In Taiga Finance, the band at the top of the Plan draws Investments and Savings against take-home, and the Cash flow report shows a realized “Savings rate”, net cash flow over income.
Questions about Savings rate
How is a savings rate calculated?
What goes to investments and savings, divided by income. $600 plus $300 over $6,000 of take-home is 15%; over $7,500 of gross it is 12%. A realized version takes income minus spending, over income.
Is a savings rate figured on gross or take-home pay?
Either, and the figure means little until the basis is stated. Take-home is the smaller number, so the same contributions make a higher rate over it. In Taiga Finance the Plan's band draws planned amounts against take-home, and the Cash flow rate divides by deposits as they land, so both are take-home figures.
Does Taiga Finance show a savings rate?
The Plan's band draws Investments and Savings as segments of take-home, in dollars, with no rate. The Cash flow report labels a figure “Savings rate”: net cash flow divided by income for the period, and the same rate closes the Plan vs. actuals table.