Spending pace
Burn rateSpending pace is how much of a month's spending has happened by a given day, set against how much of the month has gone by. Spent so far is compared with the same share of the planned amount, or with what earlier months had reached by the same day, and the difference reads as ahead of or behind pace.
What is spending pace?
A month-to-date total on its own has nothing to be read against: $1,700 spent is a lot on day 5 and a little on day 25. Spending pace supplies the reference point. The simplest one is the elapsed share of the month applied to the planned amount: on day 15 of a 30-day month, half of the month's plan.
A second reference is history: what earlier months had reached by the same day. Rent and insurance land in the first week and groceries arrive all month, so spending doesn't build in a straight line. Comparing against the same day of an average month allows for that shape.
Burn rate is the same measurement with a different emphasis: the rate at which cash is going out, usually stated per month, and how long the cash on hand lasts at that rate.
How spending pace works, with numbers
A household plans $3,900 of spending for a 30-day month. On day 15, $1,700 has been spent. Half the month has elapsed, so the straight-line share of the plan is $3,900 × 15 ÷ 30, or $1,950, and spending is $250 under that pace.
Against history, the reference is different. If the household's average month over the last six had reached $2,050 by day 15, the same $1,700 is $350 under the average.
- Planned spending
- $3,900
- Days elapsed over days in month
- × 15 ÷ 30
- Expected by day 15
- $1,950
- Spent so far
- − $1,700
- Under pace
- $250
Why spending pace matters
Pace turns a running total into a direction before the month ends. $1,700 halfway through a $3,900 plan is $250 under; the same $1,700 on day 10 would be $400 over. Read against the plan, the figure says whether the month is on course to land inside it.
The straight-line reference and the historical one can disagree. A month whose insurance bill lands in the first week runs ahead of a straight line and level with its own history, so which reference is in use changes what ahead means.
Spending pace in Taiga Finance
On the Plan, Taiga Finance's rail reads “This month” with “Day 11 of 30” beside it, then “Spent” against planned spending and “Over plan”, so the month's spending can be read against how far through the month it is.
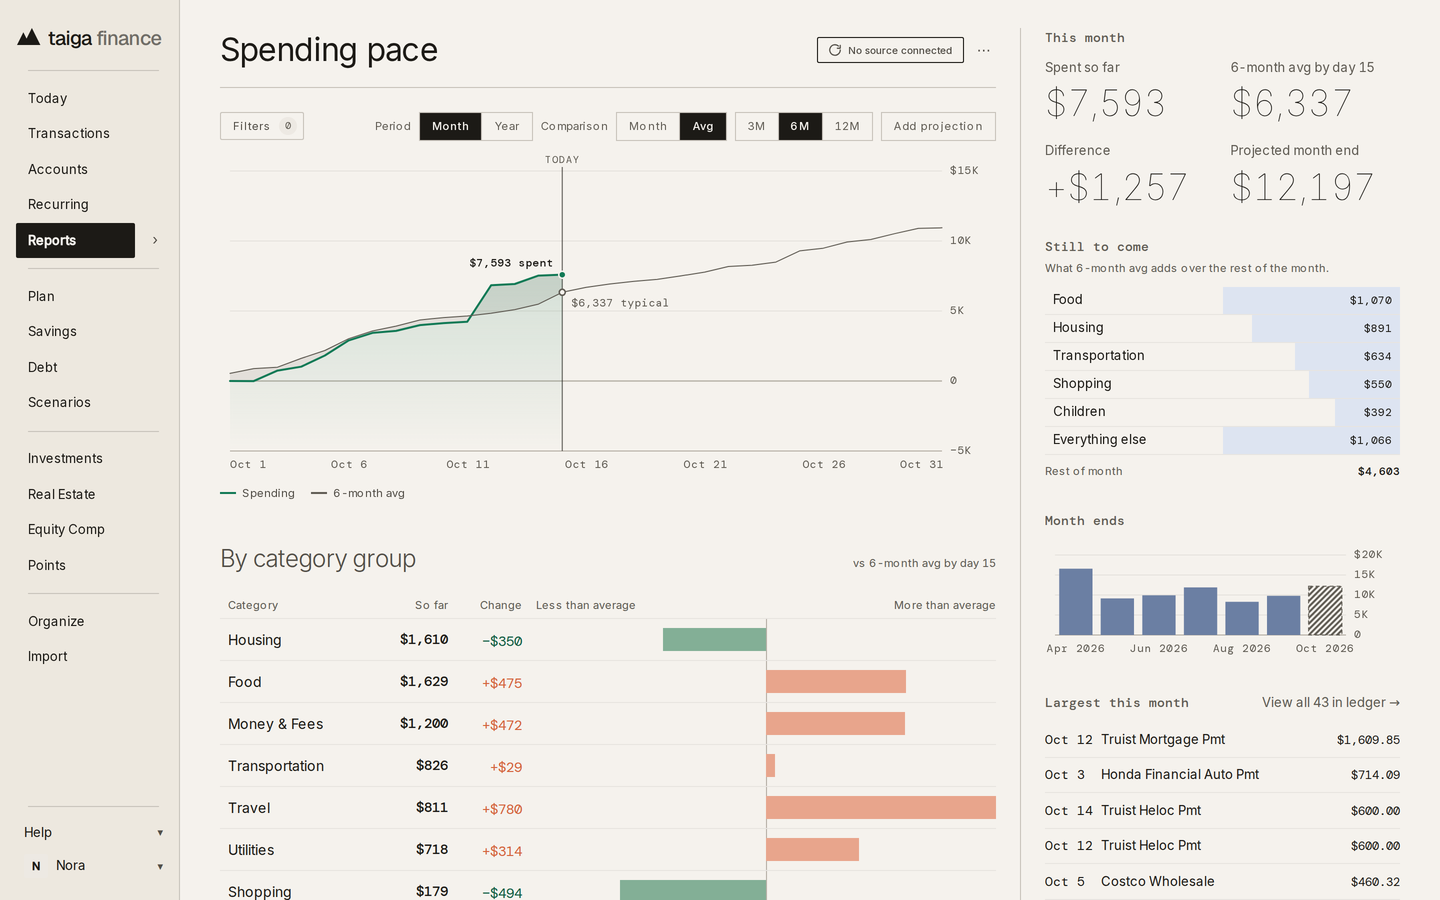
The Spending pace report, under Reports, draws this month's spending added up day by day, stopping at today, against an earlier month or the average of the last completed months, three, six or twelve, along the same days. Its figures are “Spent so far”, the comparison by day, such as “6-month avg by day 11”, “Difference”, the first minus the second, and “Projected month end”, spent so far plus what the comparison added over the rest of its month. “By category group” lists each group's “So far” and “Change” against the comparison, and the rail's “Still to come” lists what the comparison adds over the rest of the month, by group.
The report counts settled spending net of refunds; income, transfers and pending transactions are left out. With no completed month to compare against, it reads “NO PRIOR DATA” and only “Spent so far” has a value.
Scenarios & Reports →Key takeaways: Spending pace
- Spending pace is spending so far in the month set against how much of the month has gone by.
- Against a plan, the reference is the planned amount times the days elapsed over the days in the month: half the plan on day 15 of 30.
- Against history, the reference is what earlier months had reached by the same day, which allows for bills that land early.
- In Taiga Finance, the Plan rail shows the day of the month beside what has been spent, and the Spending pace report sets this month's spending against an earlier month or a recent average, day by day.
Questions about Spending pace
What is spending pace?
How much of a month's spending has happened by a given day, against how much of the month has gone by. On day 15 of a 30-day month with $3,900 planned, $1,700 spent is $250 under the straight-line share of $1,950.
Does Taiga Finance show whether spending is ahead or behind this month?
Yes, in two places. The Plan rail reads the day of the month beside what has been spent against planned spending. The Spending pace report compares this month's spending, day by day, with an earlier month or the average of the last completed months, and gives the difference by this day and a projected month end.
What is the difference between spending pace and burn rate?
The same measurement, stated differently. Burn rate is the rate cash goes out, usually per month, and how long the cash on hand lasts at it. Spending pace sets the month-to-date figure against a reference for the same point in the month, a share of the plan or an earlier month.